I recently added a custom profiler to GraphQL-Ruby. It creates traces for viewing in Perfetto, and building it was a bit of an adventure.
The final result is GraphQL::Tracing::DetailedTrace.
Why a custom profiler?
There are already a handful of ways to profile GraphQL-Ruby execution:
- Ruby-specific tools, like
stackprofandmemory_profiler - APM platforms (with GraphQL-Ruby plugins)
- Shopify/graphql-metrics, another detailed profiler
So, why create a new one?
- To tell the GraphQL story. Ruby profilers include GraphQL and non-GraphQL concerns side-by-side. With a careful eye, you can make some sense out of a flamegraph, but when Dataloader comes into play, and Fibers are starting and stopping, all bets are off.
- To support really detailed traces. APM integrations capture information from every GraphQL operation, but for cost and bandwidth reasons, some details are left out. When folks at Facebook first described their GraphQL system, they said they had a system for capturing very detailed traces on a small sample of production traffic. To my knowledge, this has not been built yet – at least not for GraphQL-Ruby – but we really need something like that for understanding performance in production. (We built something like this at GitHub but it seemed like it wasn’t quite there.)
- To be batteries-included. I want to make it easy to get started and collect useful performance insights.
Why Perfetto?
I knew I wanted something visual. In my own experience, a good graphic can make patterns very easy to spot. At first, I checked out Chrome’s trace viewer. But it immediately had a notice: “Try the new Perfetto UI!” So, I followed that link and discovered Perfetto.
At a glance, I was intrigued. There was documentation for generating traces which included:
- “Multi-track” traces for asynchronous or concurrent processes - perfect for Dataloader.
- “Flows” for connecting different events and segments with arrows. These would be good for connecting fields to the Dataloader sources they call.
- “Counters” for tracking arbitrary metrics during runtime. I used these for rendering high-level values during query execution.
Beyond this, the API for opening traces in the Perfetto web UI seemed doable, though not easy.
Prior Art
I first checked for existing Perfetto integrations for Ruby and found a few:
- perfetto.rb, a direct wrapper over the Perfetto native library. Maybe I could have used this, but it sure seemed like overkill if all I needed was a protobuf output. Its last update was about a year ago and the documentation was sparse. I didn’t investigate it much more closely than that.
- gvl-tracing, a gem that uses Perfetto to visualize GVL contention during program execution. This application of Perfetto was like my intended one – interesting – but it turns out that under the hood, it actually builds a JSON trace and takes advantage of Perfetto’s ability to render Chrome traces. That approach wouldn’t support the features I was interested in.
- Cirron, a C++-based profiler with Ruby and Python support. It also uses JSON for traces.
So, I decided I’d write my own code to produce Perfetto traces.
Building Traces
Perfetto expects protobuf payloads. My previous experience with protobuf was minimal: it was used some places in GitHub and it gave me the spooks, so I stayed away. Now it was time to dive in … so I did! I spent a lot of time with the protobuf Ruby doc and the full Perfetto schema.
In the end, I copied just the minimal amount – only what I needed for GraphQL-Ruby purposes. (Perfetto has extensive support for Chrome and Android, but none of that was relevant to me.)
Then, in Ruby-land, I implemented a GraphQL trace module whose methods prepared protobuf objects for eventual reporting. There were a few tricky parts…
Fiber starts/stops
The truth is, when I started this project, GraphQL-Ruby’s tracing hooks didn’t support my use case. I needed better insight into when Ruby fibers started and stopped so that I could terminate segments for GraphQL fields which called out to Dataloader. (When a field calls dataload(...), and the value isn’t already in the cache, then the fiber is stopped.)
So, I added some new tracing hooks: dataloader_fiber_yield(source), called when Dataloader causes a fiber to yield, and dataloader_fiber_resume(source), called when a previously-yielded fiber resumes execution. Since this happens when a source is invoked, I passed the source instance to the hook, too.
Using this new hook, I could store the active segment for a given fiber (using Fiber::[]=), then terminate it during dataloader_fiber_yield. I’d keep it around, though – then create a duplicate of it during dataloader_fiber_resume. In this arrangement, a GraphQL field whose execution is paused by waiting for Dataloader is rendered as two segments: one before the dataload(...) call and one after it:
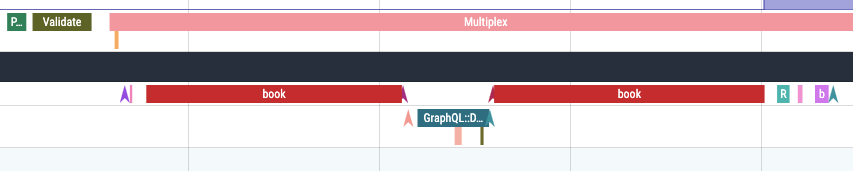
The book field paused here.
Flows
Perfetto’s “flows” link one segment to another with a little arrow. I wanted to use them to link GraphQL fields to the Dataloader sources that they called. That way, when a source fetched data, you could readily see which fields had requested data from that source.
But the problem is, when a GraphQL field starts, you don’t know if it’s going to call into Dataloader. I could address this in the new dataloader_fiber_yield hook. Before terminating the segment for a GraphQL field, I’d create an arbitrary flow_id value for it, then assign it to the segment. Then, since dataload_fiber_yield received the source instance as input, I’d cache the new flow_id in a hash where the source instance was key.
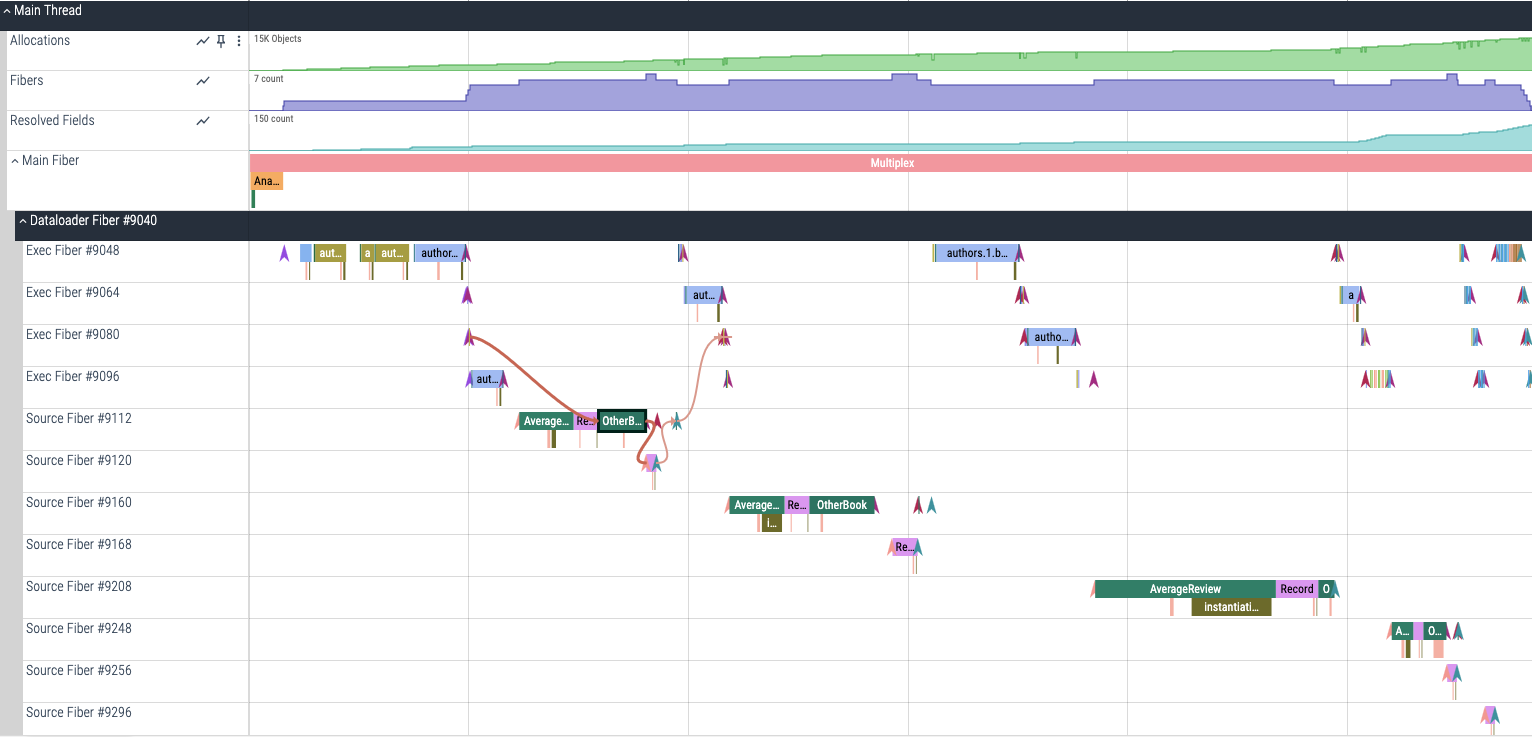
That way, when Dataloader started running that source, it could fetch out the flow_ids which were waiting for it, then assign them to its own segment. The result was some nice arrows:
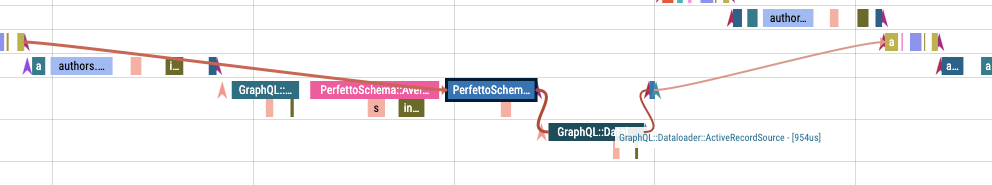
In this example, a field called a Dataloader source, and that source called another source, then each one returned.
Counters
Perfetto’s “counters” appear as bar graphs at the top of profiles. When creating traces, you log the current value of the counter for rendering, or, if you defined the counter with is_incremental: true, you can log the difference since the previous message.
I added counters for allocated objects, active fibers, and resolved GraphQL fields:
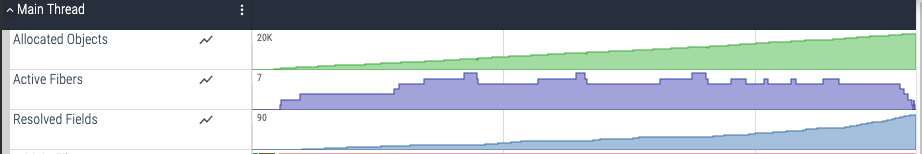
As a convenience, Perfetto’s schema allows you to “sneak” counter updates into other events, so it’s easy to update the counters often.
Metadata
Perfett can render any metadata you throw at it. It has a general-purpose DebugAnnotation message for this.
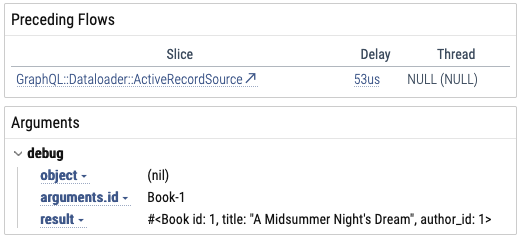
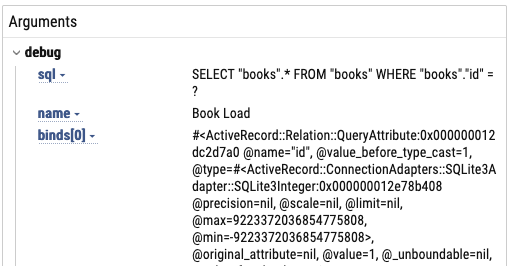
For fields, I made it add the object, arguments, and return value:
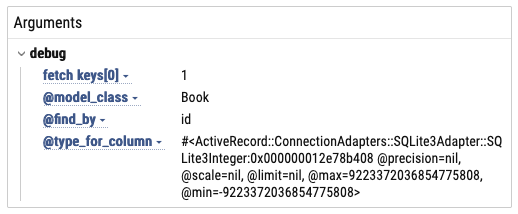
For Dataloader sources, it logs the fetch arguments and all the source’s instance variables:
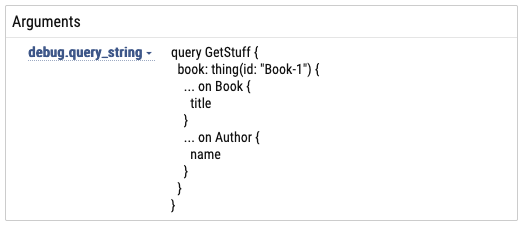
The Multiplex event contains the query string:
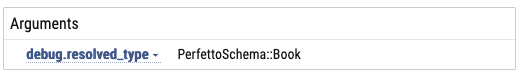
Other events have metadata, too. For example, “Resolve Type” shows the result of the Schema.resolve_type hook:
I even made it catch ActiveSupport::Notifications events and log them:
As people try this out, I imagine we’ll make improvements to what shows up here.
Interning
To reduce payload size, Perfetto supports “interning” strings. Basically, for any string field in the schema, there’s also a ..._iid field which accepts an integer. So, there’s name and name_iid. Any time you would send a certain name, you could send an integer name_iid instead. That way, there aren’t duplicated strings in the payload.
Then, there’s also a way to send newly-interned strings, along with their IDs, in other Perfetto messages. After that, you can send _iids instead of strings for anything that was “interned.”
This makes a lot of sense in GraphQL where field, argument, and type names will be often repeated. Even DebugAnnotation takes a name_iid, so those can be deduplicated in trace payloads.
Ruby-wise, this was fun to implement. There was a top-level hash mapping strings to their interned IDs, and there was a @new_iids hash for strings which had been used in a payload but reported as interned yet. At the end of each message, each entry in the @new_iids hash was turned into a protobuf message, then the hash was cleared.
Now that I write it, I wonder: could I have “just” use .object_id for a string’s iid? I’d still need some list of newly-used strings, but then I could eliminate the lookup hash of iids. (I’d still need a Set to keep track of which strings were newly-added.) I’ll have to try that later.
Sampling
Another factor in this system is when to store a sample. I haven’t measured the overhead of this tracer yet, but in any case, you wouldn’t want to store a trace from every request. Instead, you specify when to store a trace by implementing def self.detailed_trace?(context) in your schema. If it returns true, then the new tracer runs. You could use this hook in many ways:
rand(100) < sample_percentageto sample a random percentage of traffic- Check
context[...]to only sample for certain clients - Check
context.query.selected_operation_nameto sample certain named queries - Use a request header or param to set an opt-in flag, then check
context[:use_detailed_trace] - You could even delegate it all to Flipper and just call out to Flipper from that method
Saving Traces
Since a trace is “just” a protobuf blob, storing it is pretty straightforward. I implemented a Redis backend right out of the gate, but it could also be done through ActiveRecord. (And I also built an in-memory implementation for testing, but it wouldn’t work in a multi-process deployment.)
Then, I also made a little UI to go with it, so you can see your system’s stored traces:
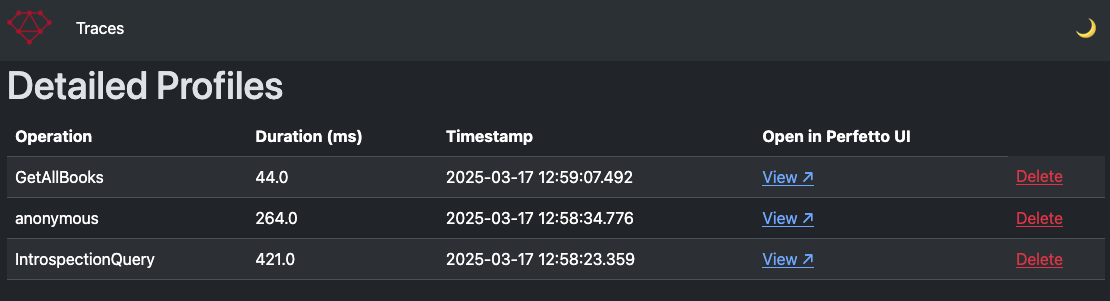
Like the tracer itself, plenty of room for improvement as people find what works for them.
Try it
If you want to give it a go, you can add GraphQL::Tracing::DetailedTrace to your GraphQL schema like this:
  use GraphQL::Tracing::DetailedTrace, redis: ...

  def self.detailed_trace?(context)
    # TODO implement to return true or false
  end
You’ll also need GraphQL::Dashboard to inspect results.